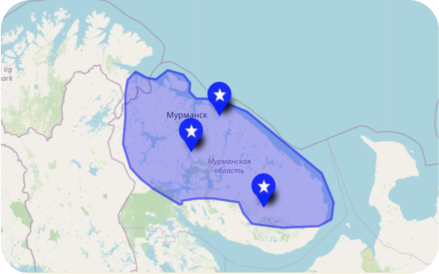
Return

Demographics

In recent decades, the demographic indicators of the minorities of the Khanty-Mansi autonomous area – Yugra have gone steadily up. Additionally, the birth rate and natural increase of the population of the minorities of Yugra in 2010 were higher than the overall data for the area: the birth rate in the district (all population) is 16.2 per thousand, the natural increase (all population) is 9.4 per thousand.

The total number of Khanty, according to the All-Russian population censuses, was: in 2002 - 28,678 people (13,033 men, 15,645 women); in 2010 – 30,943 people (14,134 men, 16,809 women), in 2020 – 31,467 people (14,560 men, 16,907 women).

Population dynamics

Years

1926

1939

1959

1970

1979

1989

2002

2010

THE KHANTY

22 306

18 468

19 410

21 138

20 934

22 283


28 678

30 943

Distribution by age and gender (according to the census of 2010, people)


Urban and rural populations

Urban population

Rural population

Men and women

men

women

Men and women

men

women

Men and women

men

women

THE KHANTY

30 181

13 827

16 354

11 324

4 887

6 437

18 857

8 940

9 917

age:


0 – 4

3409

1747

1662

1233

635

598

2176

1112

1064

5 – 9

2897

1436

1461

1050

543

507

1847

893

954

10 – 14

2641

1368

1273

814

422

392

1827

946

881

15 – 17

1722

857

865

613

297

316

1109

560

549

18 – 19

1377

638

739

658

276

382

719

362

357

20 – 24

3174

1533

1641

1340

607

733

1834

926

908

25 – 29

2702

1250

1452

1188

516

672

1514

734

780

30 – 34

2133

995

1138

906

388

518

1227

607

620

35 – 39

1982

848

1134

702

270

432

1280

578

702

40 – 44

1924

808

1116

636

230

406

1288

578

710

45 – 49

2014

855

1159

706

251

455

1308

604

704

50 – 54

1575

623

952

543

184

359

1032

439

593

55 – 59

1052

387

665

372

109

263

680

278

402

60 – 64

560

204

356

208

65

143

352

139

213

65 – 69

335

101

234

120

39

81

215

62

153

70 and older

682

175

507

235

55

180

447

120

327


Age not specified

2

2

-

-

-

-

2

2

-


below working age

9486

4815

4671

3260

1677

1583

6226

3138

3088

working age

18451

8530

9921

7238

3051

4187

11213

5479

5734

Older than working age

2242

480

1762

826

159

667

1416

321

1095

Median age

24,8

22,8

26,8

24,8

22,1

27,2

24,8

23,2

26,5